
Introduction
Over the past twenty years, I’ve had the privilege of working with many great developers. A good developer can write testable and maintainable code that allows the team to provide new features to customers. I believe a good developer should also be a good engineer and one simple way we can begin to do this is by measuring the things we do! Bearing this in mind, I decided to look for some ways of measuring parts of our system to see if it could help us improve the way we build and maintain our Web applications here at Mpowered.
While one of the core functions of developers is to add new functionality to applications, it is also critical that we ensure that the system remains secure, performant, stable, and highly available for its users as we do this. These qualities are not trivial to ensure, and even experienced developers can occasionally slip up. Conversely, it is possible to over-engineer solutions that slow the pace of new features while providing no measurable improvement in quality. Ultimately, our measurements are helping us discover how better to hit that sweet spot – improving functionality without slowing or bogging down the system unnecessarily.
Low-hanging fruit
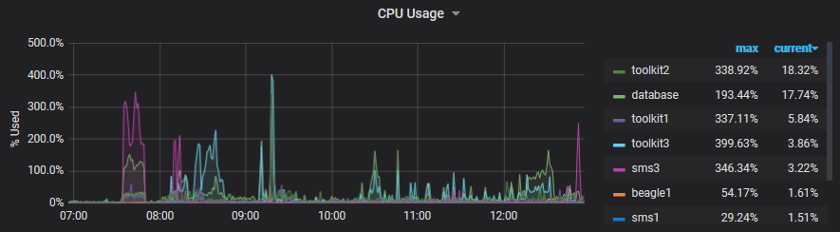
Our first phase involved measuring the easy stuff, namely system performance and resource usage on the servers our applications run on. Seeing CPU, RAM, and disk utilisation across multiple servers on a single graph highlighted interactions between systems. Comparing average and peak usage helped us size key services such as our database and job queue workers. Looking ahead, we plan to leverage this data to help us know when and how to upgrade our infrastructure. The idea is to dynamically scale up our system during busy times by looking at long term trends as well as live performance data.
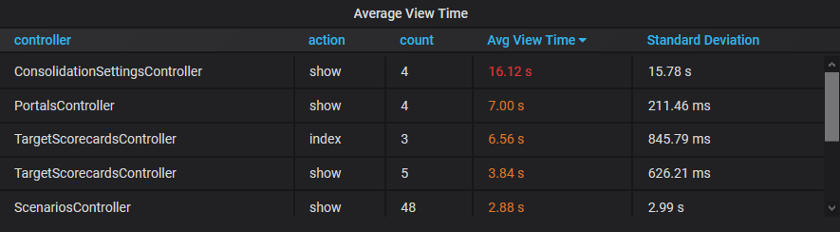
The second set of metrics we added was at the application level. This included tracking the number of active web connections, the type and duration of web requests, and similar information about our background jobs. We identified several web pages and offline tasks that were taking longer than we wanted. Code once adequate now needed to be improved, due to the increasing size and complexity of the data our customers work with today.
A detailed list of users and accounts with slow queries guided us when generating sample data for testing. Measurements before and after we adjusted our code helped us to confirm the changes were performing as expected. Profiling a running application this way has been invaluable in helping our team prioritise work so that we can focus on tackling the most pressing issues first.
Web request times by type
Something I did not initially anticipate when picking TimescaleDB is that I can create partial measurements and then update them from different places throughout a distributed system. Our job system, for example, creates a job entry when first adding it to a queue, and our workers later update the start and completion times.
We can tell a job is waiting in a queue when it has been enqueued but does not yet have a start time, and similarly, we can tell when it is running or has been completed. This information allows us to track how long jobs sit in the various queues and how long they take to run. Tracking these durations helps inform us where adding more workers in parallel is beneficial, or if we should investigate making particular sections of code more performant.
Measure all the things!
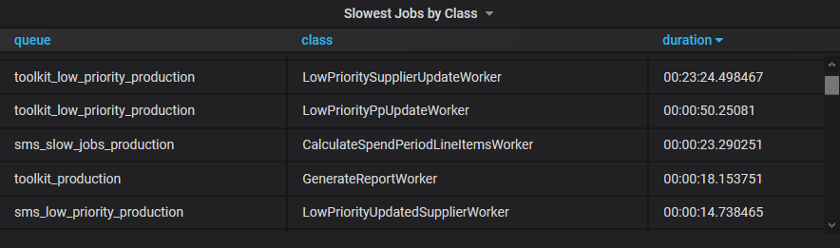
TimescaleDB also allows me to capture as much information as I think might be relevant later, and worry about how to present it when discovering which tables and graphs are ultimately useful. Leveraging existing SQL tooling makes it easy to transform data later on. For example, we also captured each job’s identifier, the queue it was added to, and which worker ran it. These additional fields allowed us to identify the slowest performing job of each type and investigate the worst offenders.
Slow jobs by type
Where possible, developers are also encouraged to add metrics before investigating bugs and performance-related issues. It’s useful to demonstrate where the current code is not running as intended and decide on a reasonable target for which we consider a fix as “done”. Once the measurements are in place, Grafana allows us to place alerts to track these values going forward and alert us if it’s something we need to revisit in the future. As such, we continue to add application metrics as our applications grow and mature.
Looking ahead
The final set of metrics we’re adding right now are project-related ones. We track the number of bugs reported by Honeybadger to get a feel for long term trends and hope to use this information to guide our development sprints. It would be interesting, for example, to see if there is an increase in certain types of bugs on our staging environment after a big feature-focused push. By examining which class of errors we missed, we can guide our code reviews and decide how to catch them earlier during automated testing.
Conclusion
Measuring your system is a great way to locate which areas of your code require the most attention. Additionally, it is incredibly rewarding to see improvements to your production system shown graphically when completing tasks. Graphs and alerts can be placed on a dashboard and displayed in the office to give a real-time view of the environment that everyone can see. It was very encouraging to find non-technical people take an interest in this data, which in turn stimulated other conversations about the inner workings of our application.
After keeping our metrics open on a second monitor for a few weeks, I became so accustomed to the baseline values that I was able to tell almost sub-consciously when something out of the ordinary was happening! It has instilled greater confidence when working with our system, and I feel it has already paid for itself in terms of setup cost over the past few months. I can heartily recommend this approach to anyone who doesn’t already measure the things that are important to them.
Author – Shaun Sharlpes, 26 May 2020