
It is 2021, and you managed to implement a data analytics tool – like Mpowered Analytics – alongside your BEE tracking tool. The BEE data is finally unlocked, and you are excited to create all the interactive charts you have been dreaming of. Your reporting is about to become amazing – or so you think!
An unexpected problem confronts you: the blank canvas and world of reporting possibilities have you feeling a little lost and overwhelmed.
What charts do you need, or which data points should you be tracking? What do your stakeholders care about most? What metrics will help you move the needle?
Getting your BEE analytics project off the ground can be surprisingly daunting. I found one principle helped me get going:
“Know the difference between exploratory and declarative analytics”
There are many different “types” of data analytics, each with its specific objective and approach. The two types of analytics that I find most applicable when kicking off a BEE analytics project are “exploratory” and “declarative” analytics.
Let us take a quick look at them:
Exploratory analytics
Exploratory dashboards are all about searching. They help you ‘mine’ your data, looking for patterns to establish a high-level overview of what is going on in your business.
These are the kind of dashboards that make up your ‘morning paper’. The dashboards are for your consumption, with a strong cup of coffee and an enquiring, scientific mindset.
These dashboards are often ‘noisy’, with many charts side-by-side. They compare BU to BU, looking at various trends across a range of time.
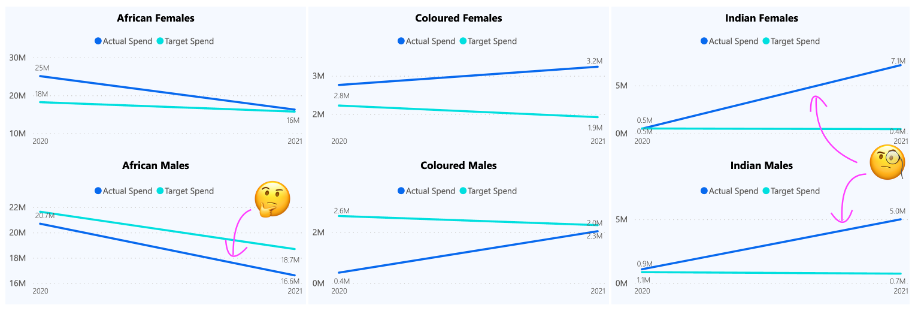
Let’s look at the example above. Here we are looking at Skills Development spend across EAPs over time. We can see a problematic pattern emerging: Spend on African people is declining over time, dropping below the target, while spend on Indian and Coloured people is climbing fast, exceeding the targets vastly. There is probably some ‘oversteer’ to correct a previously weak distribution of spend across EAPs… We have found something actionable while exploring trends!
Declarative analytics (aka reporting)
This type of analytics is what most people tend to think about when we talk about dashboards – presenting data to a set of stakeholders. Declarative dashboards tell a specific story.
Declarative dashboards are the outcome of successfully using exploratory dashboards.
For instance, above we found some potential oversteer where our spend on African people is diving fast, while our spend on Indian people is far exceeding a balanced distribution.
Having found those issues, we can the prepare some declarative analytics that tell an actionable story:
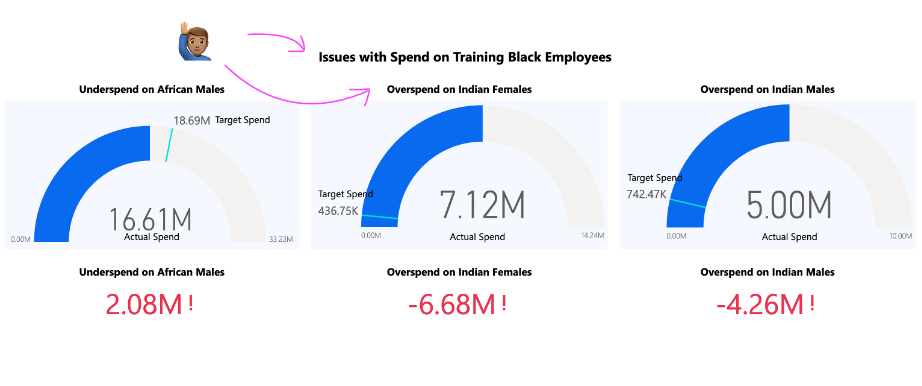
Notice how the headings of charts don’t describe the data (like in exploratory analytics), they describe the actionable insight. We’re translating the findings from our exploration into tangible changes that your stakeholders can understand and immediately and action.
You are ‘declaring’ your findings from the ‘exploration’. And that’s where data analytics makes you a superhero:
“Data analytics enable you to apply your expertise to find problems and translate them into actions that will produce positive change.”
Why is this important to know?
Understanding the types of analytics will help you focus on the right audience, intent and, therefore, the data points and charts to use going forward.
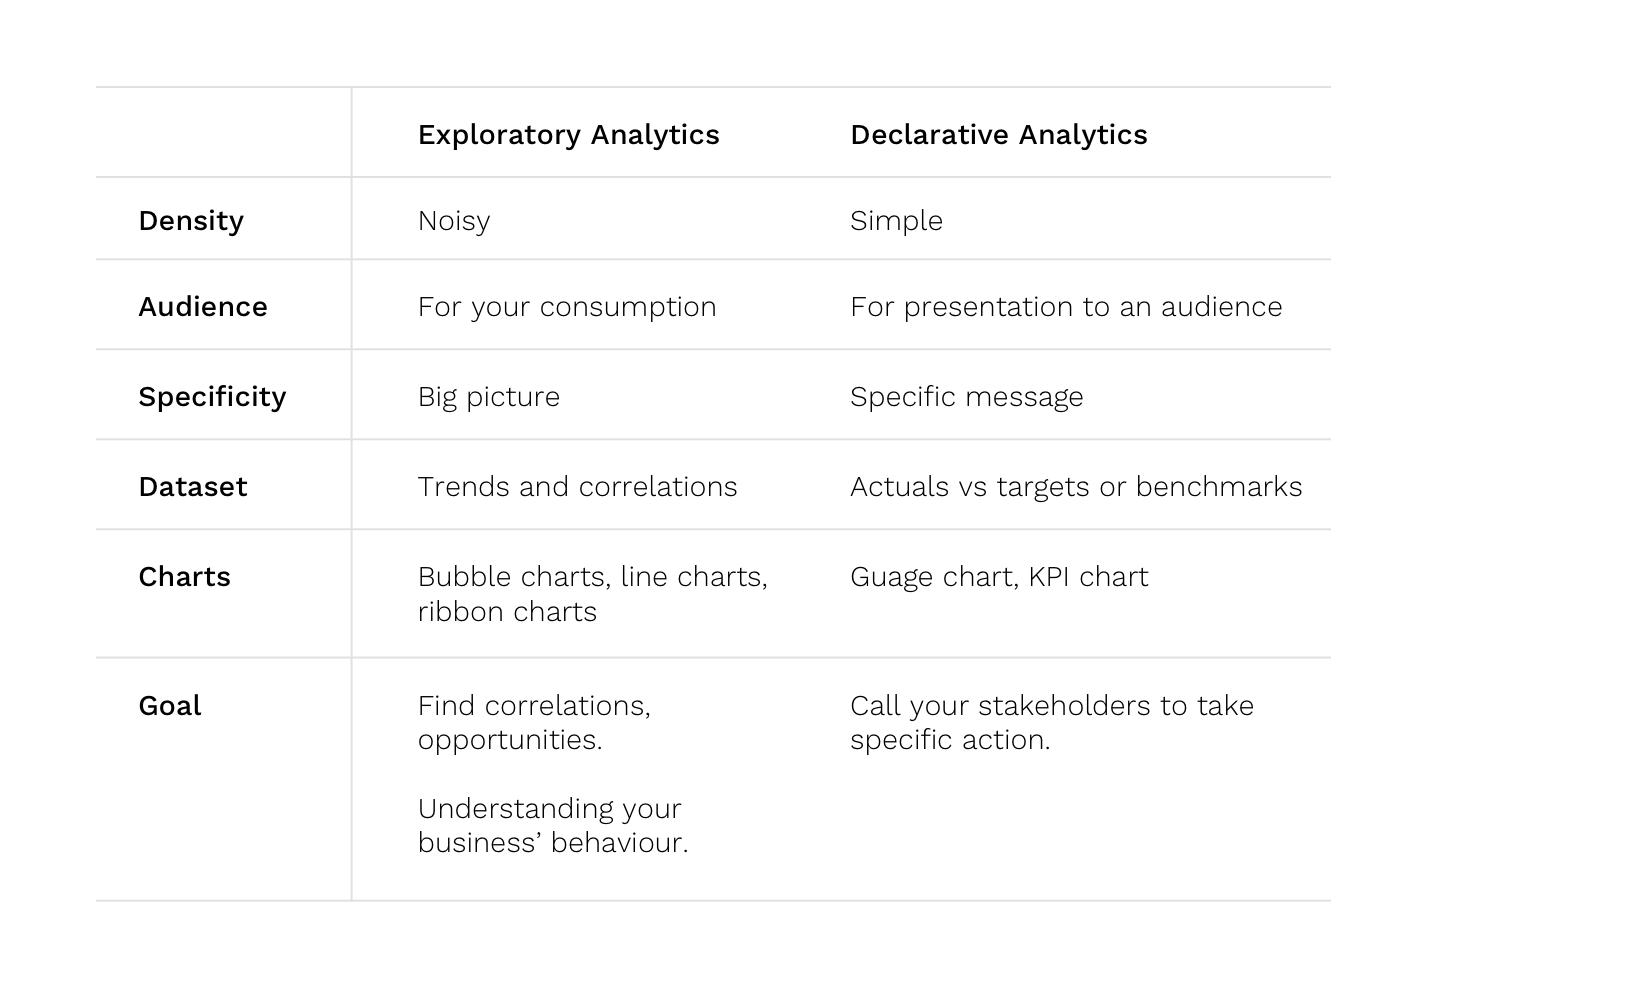
Here is a little cheat sheet you can use to help you on your analytics journey:
Mpowered has launched a robust product and service that makes your BEE analytics or reporting easier and more meaningful. Head over to our website or book your demo with the team to see just how powerful this BEE reporting tool is!
Author – Gary Greyling, Mpowered’s very own obsessed product developer.